Introduction
TexMesonet is a statewide earth observation network managed by the Texas Water Development Board (TWDB). TWDB stations collect near-real-time weather and soil observations, including air temperature, humidity, precipitation, wind, solar radiation, soil temperature, and soil moisture.
preMetabolizer provides three helpers for the public TexMesonet API:
-
tex_meso_stations()retrieves TWDB station metadata. -
tex_meso_current()retrieves the most recent observation from each TWDB station. -
tex_meso_timeseries()retrieves recent time-series observations for one station.
Note: These functions contact the TexMesonet API and require an internet connection. Code chunks that call the API will not run during package installation if the service is unreachable. Run them interactively in your own session.
Caching downloaded data
Repeated calls to the TexMesonet API download the same data on every run. This vignette saves each result to a local cache directory the first time it is downloaded and reloads from disk on subsequent runs. The cache lives in tools::R_user_dir("preMetabolizer", which = "cache"), a platform-appropriate, user-specific directory that persists across sessions. Each data-fetching chunk below checks for a cached .rds file, downloads and saves on the first run, and reloads from disk on all subsequent runs.
Discover TWDB stations
Use tex_meso_stations() to retrieve station names, IDs, display IDs, coordinates, elevation, activity status, and online dates.
cache_file <- file.path(cache_dir, "tex_meso_stations.rds")
if (!file.exists(cache_file)) {
  stations <- tex_meso_stations()
  saveRDS(stations, cache_file)
} else {
  stations <- readRDS(cache_file)
}

glimpse(stations)
#> Rows: 137
#> Columns: 12
#> $ station_id      <int> 1, 2, 3, 4, 5, 6, 7, 8, 9, 10, 11, 12, 13, 14, 15, 16,…
#> $ station_name    <chr> "Blanco Weather Station", "Altwein Rd", "Headwaters Ra…
#> $ display_id      <chr> "BCBWS", "BCALT", "KEHEA", "BCHOR", "BCARN", "BNLCP", …
#> $ state           <chr> "TX", "TX", "TX", "TX", "TX", "TX", "TX", "TX", "TX", …
#> $ county          <chr> "Blanco", "Blanco", "Kendall", "Blanco", "Blanco", "Ba…
#> $ latitude        <dbl> 30.08906, 30.14957, 30.08845, 30.01853, 30.11047, 29.8…
#> $ longitude       <dbl> -98.41806, -98.54044, -98.69757, -98.45631, -98.30463,…
#> $ elevation       <int> 1334, 1730, 1959, 1416, 1316, 2163, 2206, 1881, 166, 3…
#> $ active          <lgl> FALSE, TRUE, TRUE, TRUE, TRUE, TRUE, TRUE, FALSE, TRUE…
#> $ station_type    <int> 1, 2, 2, 2, 2, 1, 2, 1, 1, 2, 2, 2, 2, 1, 1, 1, 1, 1, …
#> $ station_display <lgl> FALSE, TRUE, TRUE, TRUE, TRUE, TRUE, TRUE, TRUE, TRUE,…
#> $ online_date     <date> 2016-04-28, 2016-04-28, 2016-04-28, 2016-04-28, 2016-…
The active and displayed arguments make it easy to focus on stations that are currently operating and shown by TexMesonet.
cache_file <- file.path(cache_dir, "tex_meso_stations_active.rds")
if (!file.exists(cache_file)) {
  active_stations <- tex_meso_stations(active = TRUE, displayed = TRUE)
  saveRDS(active_stations, cache_file)
} else {
  active_stations <- readRDS(cache_file)
}

active_stations |>
  select(station_id, station_name, display_id, county, latitude, longitude) |>
  arrange(county, station_name)
#> # A tibble: 123 × 6
#>    station_id station_name            display_id county  latitude longitude
#>         <int> <chr>                   <chr>      <chr>      <dbl>     <dbl>
#>  1          6 Love Creek Preserve     BNLCP      Bandera     29.8     -99.4
#>  2         69 Phyllis Thomas Bandera  BNPTB      Bandera     29.7     -99.4
#>  3         37 Pecan Grove Farms       BPPGF      Bastrop     30.2     -97.5
#>  4        102 Pawnee Ranch            BEPAW      Bee         28.6     -98.0
#>  5         34 City of Rogers          BLCOR      Bell        30.9     -97.2
#>  6         33 City of Troy            BLCOT      Bell        31.2     -97.3
#>  7         35 Doc Curb Pump Station   BLDOC      Bell        31.0     -97.5
#>  8         36 River Ridge Ranch       BLRRR      Bell        31.0     -97.8
#>  9        107 EAA Field Research Park BXEAA      Bexar       29.7     -98.4
#> 10          2 Altwein Rd              BCALT      Blanco      30.1     -98.5
#> # ℹ 113 more rows
For station time-series requests, keep the integer station_id. This example finds stations in Blanco County and selects one station ID for later use.
blanco_stations <- active_stations |>
  filter(county == "Blanco") |>
  select(station_id, station_name, display_id, latitude, longitude, elevation)

blanco_stations
#> # A tibble: 4 × 6
#>   station_id station_name         display_id latitude longitude elevation
#>        <int> <chr>                <chr>         <dbl>     <dbl>     <int>
#> 1          2 Altwein Rd           BCALT          30.1     -98.5      1730
#> 2          4 Holt Oaks Ranch      BCHOR          30.0     -98.5      1416
#> 3          5 Arnosky Farms        BCARN          30.1     -98.3      1316
#> 4        108 Blanco Middle School BCMID          30.1     -98.4      1395

site_id <- blanco_stations$station_id[1]
Retrieve current observations
tex_meso_current() returns the most recent available observation from each TWDB station. Not every station measures every parameter, so some columns may contain missing values.
cache_file <- file.path(cache_dir, "tex_meso_current.rds")
if (!file.exists(cache_file)) {
  current <- tex_meso_current()
  saveRDS(current, cache_file)
} else {
  current <- readRDS(cache_file)
}

glimpse(current)
#> Rows: 123
#> Columns: 39
#> $ object_id             <int> 2, 3, 4, 5, 6, 7, 9, 10, 13, 14, 15, 16, 17, 18,…
#> $ station_id            <int> 2, 3, 4, 5, 6, 7, 9, 10, 13, 14, 15, 16, 17, 18,…
#> $ station_name          <chr> "Altwein Rd", "Headwaters Ranch", "Holt Oaks Ran…
#> $ display_id            <chr> "BCALT", "KEHEA", "BCHOR", "BCARN", "BNLCP", "RE…
#> $ latitude              <dbl> 30.14957, 30.08845, 30.01853, 30.11047, 29.80180…
#> $ longitude             <dbl> -98.54044, -98.69757, -98.45631, -98.30463, -99.…
#> $ elevation             <int> 1730, 1959, 1416, 1316, 2163, 2206, 166, 339, 48…
#> $ air_temp              <dbl> 24.93, 23.40, 25.20, 26.43, 24.05, 23.65, 22.29,…
#> $ air_temp2_m           <dbl> 24.93, 23.40, 25.20, 26.43, 24.05, 23.65, 22.29,…
#> $ humidity              <dbl> 80.60, 84.20, 79.88, 79.81, 80.90, 88.40, 97.70,…
#> $ precip                <dbl> 0.000, 0.000, 0.000, 0.000, 0.000, 0.000, NA, 0.…
#> $ precip24_hr           <dbl> 0.254, 0.000, 0.254, 0.000, 5.334, 0.000, 0.000,…
#> $ precip48_hr           <dbl> 90.678, 63.246, 48.006, 59.182, 152.654, 17.018,…
#> $ precip72_hr           <dbl> 90.932, 63.246, 48.006, 59.182, 152.654, 17.018,…
#> $ wind_speed            <dbl> 0.0000, 2.2830, 0.0000, 1.4990, 2.6794, 1.2088, …
#> $ wind_speed2_m         <dbl> 0.0000, 2.2830, 0.0000, 1.4990, 1.6991, 1.2088, …
#> $ wind_direction        <dbl> 280, 36, 57, 89, 24, 13, 83, 44, 29, 326, 0, 41,…
#> $ wind_direction2_m     <dbl> 280, 36, 57, 89, 78, 13, 143, 44, 29, 349, 63, 3…
#> $ wind_gust             <dbl> 0.0000, 4.0082, 0.0000, 2.9430, 3.8318, 3.4756, …
#> $ wind_gust2_m          <dbl> 0.0000, 4.0082, 0.0000, 2.9430, 2.4104, 3.4756, …
#> $ battery_voltage       <dbl> 14.12, 13.99, 13.53, 13.95, 14.19, 13.37, 12.72,…
#> $ soil_moisture         <dbl> 0.337, 0.441, 0.359, 0.556, 0.429, 0.340, 0.109,…
#> $ soil_temperature      <dbl> 26.55, 23.93, 26.11, 25.84, 25.58, 25.61, 26.17,…
#> $ soil_moisture5_cm     <dbl> 0.340, 0.401, 0.350, 0.468, 0.306, 0.166, 0.341,…
#> $ soil_temperature5_cm  <dbl> 24.84, 23.24, 24.71, 31.38, 24.77, 24.81, 26.07,…
#> $ soil_moisture10_cm    <dbl> 0.329, 0.319, 0.420, 0.515, 0.463, 0.239, 0.269,…
#> $ soil_temperature10_cm <dbl> 25.35, 23.33, 25.23, 26.01, 24.75, 25.11, 26.09,…
#> $ soil_moisture20_cm    <dbl> 0.337, 0.441, 0.359, 0.556, 0.429, 0.340, 0.109,…
#> $ soil_temperature20_cm <dbl> 26.55, 23.93, 26.11, 25.84, 25.58, 25.61, 26.17,…
#> $ soil_moisture50_cm    <dbl> 0.325, NA, 0.273, 0.624, NA, NA, 0.218, NA, 0.39…
#> $ soil_temperature50_cm <dbl> 26.69, NA, 25.77, NA, NA, NA, 26.00, NA, 27.50, …
#> $ data_interval_minutes <dbl> 5, 5, 5, 5, 5, 5, 5, 5, 5, 5, 5, 5, 5, 5, 5, 5, …
#> $ recorded_time         <dttm> 2026-06-16 14:10:00, 2026-06-16 14:10:00, 2026-…
#> $ air_temp9_m           <dbl> NA, NA, NA, NA, 22.88, NA, 24.92, NA, NA, 24.20,…
#> $ wind_speed10_m        <dbl> NA, NA, NA, NA, 2.6794, NA, 0.0023, NA, NA, 3.01…
#> $ wind_direction10_m    <dbl> NA, NA, NA, NA, 24, NA, 83, NA, NA, 326, 0, 41, …
#> $ wind_gust10_m         <dbl> NA, NA, NA, NA, 3.8318, NA, 0.0555, NA, NA, 4.05…
#> $ air_pressure          <dbl> NA, NA, NA, NA, 938.5323, NA, 1006.2460, NA, NA,…
#> $ solar_radiation       <dbl> NA, NA, NA, NA, 481.6354, NA, 6.8089, NA, NA, 37…
The TexMesonet API reports units in a separate object. preMetabolizer stores that object as a data-frame attribute.
attr(current, "units")
#> $air_pressure
#> [1] "Millibars"
#>
#> $air_temp
#> [1] "Celsius"
#>
#> $battery_voltage
#> [1] "Volts"
#>
#> $data_interval
#> [1] "Minutes"
#>
#> $elevation
#> [1] "Feet"
#>
#> $precipitation
#> [1] "Millimeters"
#>
#> $relative_humidity
#> [1] "Percent"
#>
#> $soil_moisture
#> [1] "Centimeters Cubed per Centimeters Cubed"
#>
#> $soil_temp
#> [1] "Celsius"
#>
#> $solar_radiation
#> [1] "Watts per Square Meter"
#>
#> $wind_speed
#> [1] "Meters per Second"
For a quick station check, join current observations to station metadata or filter directly by station_id.
current |>
  filter(station_id == site_id) |>
  select(
    station_id,
    station_name,
    recorded_time,
    air_temp,
    humidity,
    precip,
    wind_speed,
    air_pressure
  )
#> # A tibble: 1 × 8
#>   station_id station_name recorded_time       air_temp humidity precip
#>        <int> <chr>        <dttm>                 <dbl>    <dbl>  <dbl>
#> 1          2 Altwein Rd   2026-06-16 14:10:00     24.9     80.6      0
#> # ℹ 2 more variables: wind_speed <dbl>, air_pressure <dbl>
Retrieve recent time series
tex_meso_timeseries() retrieves observations for a single station over a look-back window measured in minutes. By default, variable = "all" uses the TexMesonet charting-fields endpoint and returns all fields available for that station.
cache_file <- file.path(cache_dir, "tex_meso_timeseries_blanco.rds")
if (!file.exists(cache_file)) {
  recent <- tex_meso_timeseries(
    site_id = site_id,
    prior_minutes = 24 * 60
  )
  saveRDS(recent, cache_file)
} else {
  recent <- readRDS(cache_file)
}

glimpse(recent)
#> Rows: 96
#> Columns: 27
#> $ air_temp           <dbl> 24.88, 24.03, 23.06, 22.13, 21.34, 20.62, 20.23, 20…
#> $ air_temp9_m        <dbl> NA, NA, NA, NA, NA, NA, NA, NA, NA, NA, NA, NA, NA,…
#> $ humidity           <dbl> 84.0, 87.5, 99.9, 99.9, 99.9, 99.9, 99.9, 99.9, 99.…
#> $ precip             <dbl> 0.000, 0.000, 0.000, 0.000, 0.000, 0.000, 0.000, 0.…
#> $ wind_speed         <dbl> 0, 0, 0, 0, 0, 0, 0, 0, 0, 0, 0, 0, 0, 0, 0, 0, 0, …
#> $ wind_speed2_m      <dbl> 0, 0, 0, 0, 0, 0, 0, 0, 0, 0, 0, 0, 0, 0, 0, 0, 0, …
#> $ wind_speed10_m     <dbl> NA, NA, NA, NA, NA, NA, NA, NA, NA, NA, NA, NA, NA,…
#> $ wind_direction     <dbl> 168, 60, 86, 354, 331, 305, 299, 334, 330, 310, 18,…
#> $ wind_direction2_m  <dbl> 168, 60, 86, 354, 331, 305, 299, 334, 330, 310, 18,…
#> $ wind_direction10_m <dbl> NA, NA, NA, NA, NA, NA, NA, NA, NA, NA, NA, NA, NA,…
#> $ wind_gust2_m       <dbl> 0, 0, 0, 0, 0, 0, 0, 0, 0, 0, 0, 0, 0, 0, 0, 0, 0, …
#> $ wind_gust10_m      <dbl> NA, NA, NA, NA, NA, NA, NA, NA, NA, NA, NA, NA, NA,…
#> $ air_pressure       <dbl> NA, NA, NA, NA, NA, NA, NA, NA, NA, NA, NA, NA, NA,…
#> $ solar_radiation    <dbl> NA, NA, NA, NA, NA, NA, NA, NA, NA, NA, NA, NA, NA,…
#> $ soil_moist5        <dbl> 0.340, 0.340, 0.340, 0.340, 0.341, 0.341, 0.341, 0.…
#> $ soil_moist10       <dbl> 0.329, 0.330, 0.330, 0.330, 0.330, 0.330, 0.330, 0.…
#> $ soil_moist20       <dbl> 0.338, 0.338, 0.338, 0.338, 0.338, 0.338, 0.339, 0.…
#> $ soil_moist50       <dbl> 0.325, 0.326, 0.326, 0.326, 0.326, 0.326, 0.326, 0.…
#> $ soil_temp5         <dbl> 24.81, 24.81, 24.82, 24.84, 24.89, 24.90, 24.93, 25…
#> $ soil_temp10        <dbl> 25.34, 25.37, 25.42, 25.42, 25.48, 25.51, 25.53, 25…
#> $ soil_temp20        <dbl> 26.53, 26.61, 26.60, 26.61, 26.65, 26.68, 26.71, 26…
#> $ soil_temp50        <dbl> 26.68, 26.69, 26.69, 26.68, 26.68, 26.70, 26.70, 26…
#> $ water_level        <dbl> NA, NA, NA, NA, NA, NA, NA, NA, NA, NA, NA, NA, NA,…
#> $ water_temp         <dbl> NA, NA, NA, NA, NA, NA, NA, NA, NA, NA, NA, NA, NA,…
#> $ water_level2       <dbl> NA, NA, NA, NA, NA, NA, NA, NA, NA, NA, NA, NA, NA,…
#> $ water_temp2        <dbl> NA, NA, NA, NA, NA, NA, NA, NA, NA, NA, NA, NA, NA,…
#> $ date_time          <dttm> 2026-06-16 14:00:00, 2026-06-16 13:45:00, 2026-06-…
The returned date_time column is parsed as UTC.
Retrieve one variable
TexMesonet also provides smaller single-variable endpoints. Use the variable argument when you only need one series.
cache_file <- file.path(cache_dir, "tex_meso_timeseries_blanco_temperature.rds")
if (!file.exists(cache_file)) {
  temperature <- tex_meso_timeseries(
    site_id = site_id,
    prior_minutes = 24 * 60,
    variable = "temperature"
  )
  saveRDS(temperature, cache_file)
} else {
  temperature <- readRDS(cache_file)
}

temperature |>
  arrange(date_time) |>
  tail()
#> # A tibble: 6 × 2
#>   value date_time
#>   <dbl> <dttm>
#> 1    75 2026-06-16 13:45:00
#> 2    76 2026-06-16 13:50:00
#> 3    77 2026-06-16 13:55:00
#> 4    77 2026-06-16 14:00:00
#> 5    77 2026-06-16 14:05:00
#> 6    77 2026-06-16 14:10:00

attr(temperature, "units")
#> [1] "Fahrenheit"
Available single-variable values are "temperature", "humidity", "barometric_pressure", "precip", and "wind_speed".
Example workflow: station weather summary
The charting-fields endpoint is useful when you want to prepare local meteorological covariates for a stream site. The example below summarizes hourly temperature, humidity, precipitation, and wind speed from the recent station data.
hourly_weather <- recent |>
mutate(hour = lubridate::floor_date(date_time, "hour")) |>
group_by(hour) |>
summarise(
air_temp_C = mean(air_temp, na.rm = TRUE),
humidity_pct = mean(humidity, na.rm = TRUE),
precip_mm = sum(precip, na.rm = TRUE),
wind_speed_m_s = mean(wind_speed, na.rm = TRUE),
.groups = "drop"
)
hourly_weather
#> # A tibble: 25 × 5
#> hour air_temp_C humidity_pct precip_mm wind_speed_m_s
#> <dttm> <dbl> <dbl> <dbl> <dbl>
#> 1 2026-06-15 14:00:00 21.0 99.9 0 0
#> 2 2026-06-15 15:00:00 21.9 99.8 0 0
#> 3 2026-06-15 16:00:00 23.3 87.5 0 0
#> 4 2026-06-15 17:00:00 25.1 77.1 0 0
#> 5 2026-06-15 18:00:00 26.5 70.7 0 0.0208
#> 6 2026-06-15 19:00:00 26.9 68.5 0 0
#> 7 2026-06-15 20:00:00 26.6 69.0 0 0
#> 8 2026-06-15 21:00:00 26.7 73.4 0 0.0446
#> 9 2026-06-15 22:00:00 26.8 70.6 0 0.0567
#> 10 2026-06-15 23:00:00 25.8 78.8 0 0
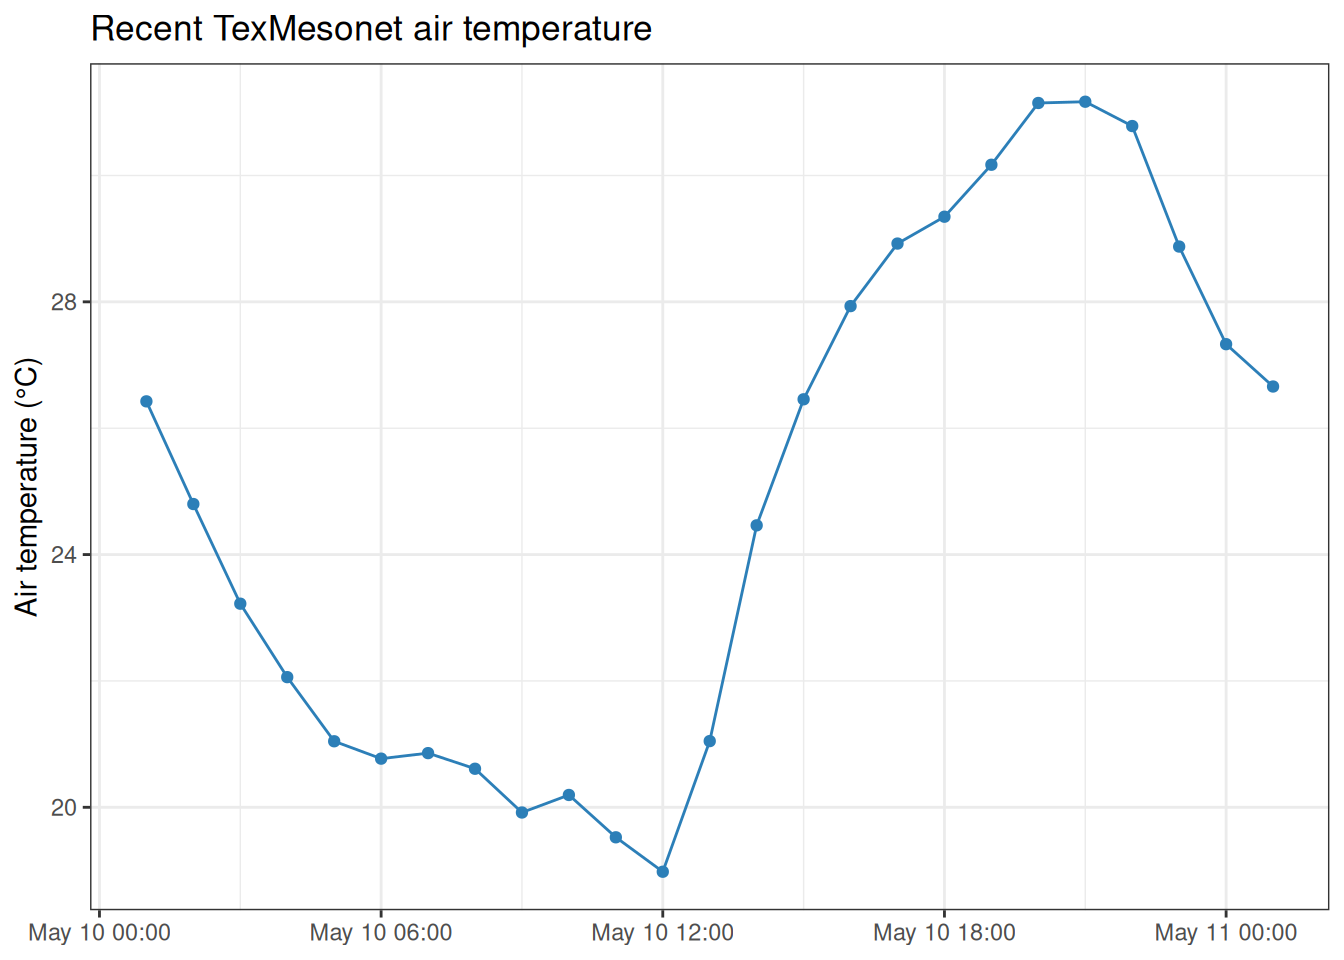
#> # ℹ 15 more rowsPlotting the recent series can help identify gaps or station behavior before combining meteorological data with stream logger observations.
API scope
These functions use the lightweight TexMesonet API endpoints for TWDB stations. For historical custom downloads, longer date ranges, or non-TWDB provider networks shown in the TexMesonet map viewer, use the TexMesonet Custom Downloads page or the source network recommended by TWDB.