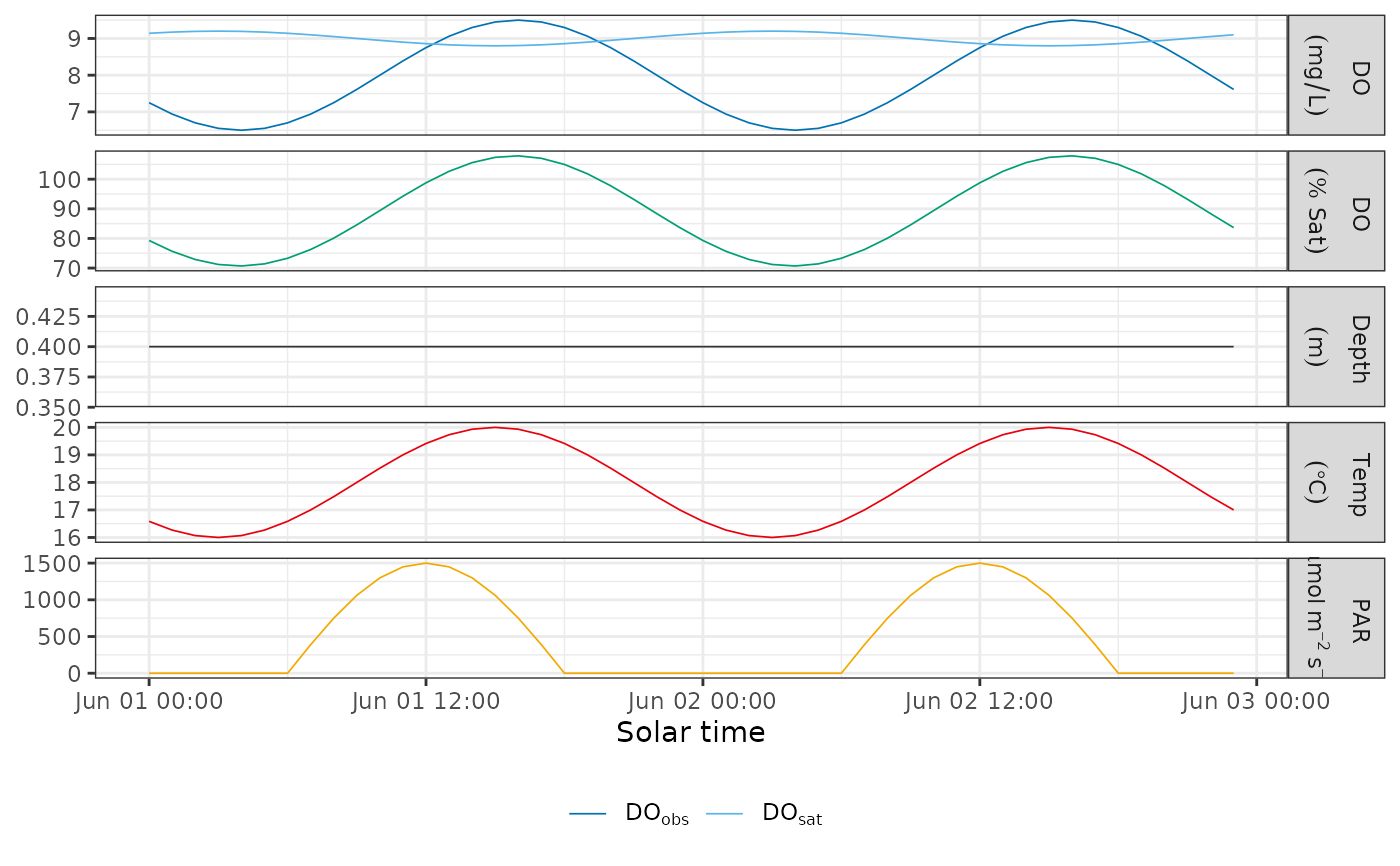
Creates a time-series plot of the selected input variables, chosen from dissolved oxygen, dissolved oxygen saturation, water depth, water temperature, and photosynthetically active radiation. The input must use the column names returned by common streamMetabolizer workflows.
Usage
plot_metab_data(
  data,
  cols = c("DO.obs", "DO.sat", "depth", "temp.water", "light")
)
Arguments
- data
A data frame or tibble with a
solar.timecolumn and the measurement columns named incols. The measurement columns must be numeric.- cols
Character vector of measurement columns to plot. Any subset of
"DO.obs","DO.sat","depth","temp.water", and"light". Defaults to all five. The dissolved oxygen saturation percentage panel is shown when both"DO.obs"and"DO.sat"are selected.
Value
A ggplot object. The dissolved oxygen saturation percentage is
calculated as 100 * DO.obs / DO.sat; values where DO.sat is zero are
shown as missing.
Examples
hours <- 0:47
data <- tibble::tibble(
solar.time = as.POSIXct("2024-06-01", tz = "UTC") + hours * 3600,
DO.obs = 8 + 1.5 * sin((hours - 10) / 24 * 2 * pi),
DO.sat = 9 - 0.2 * sin((hours - 9) / 24 * 2 * pi),
depth = 0.4,
temp.water = 18 + 2 * sin((hours - 9) / 24 * 2 * pi),
light = pmax(0, sin((hours - 6) / 12 * pi)) * 1500
)
plot_metab_data(data)
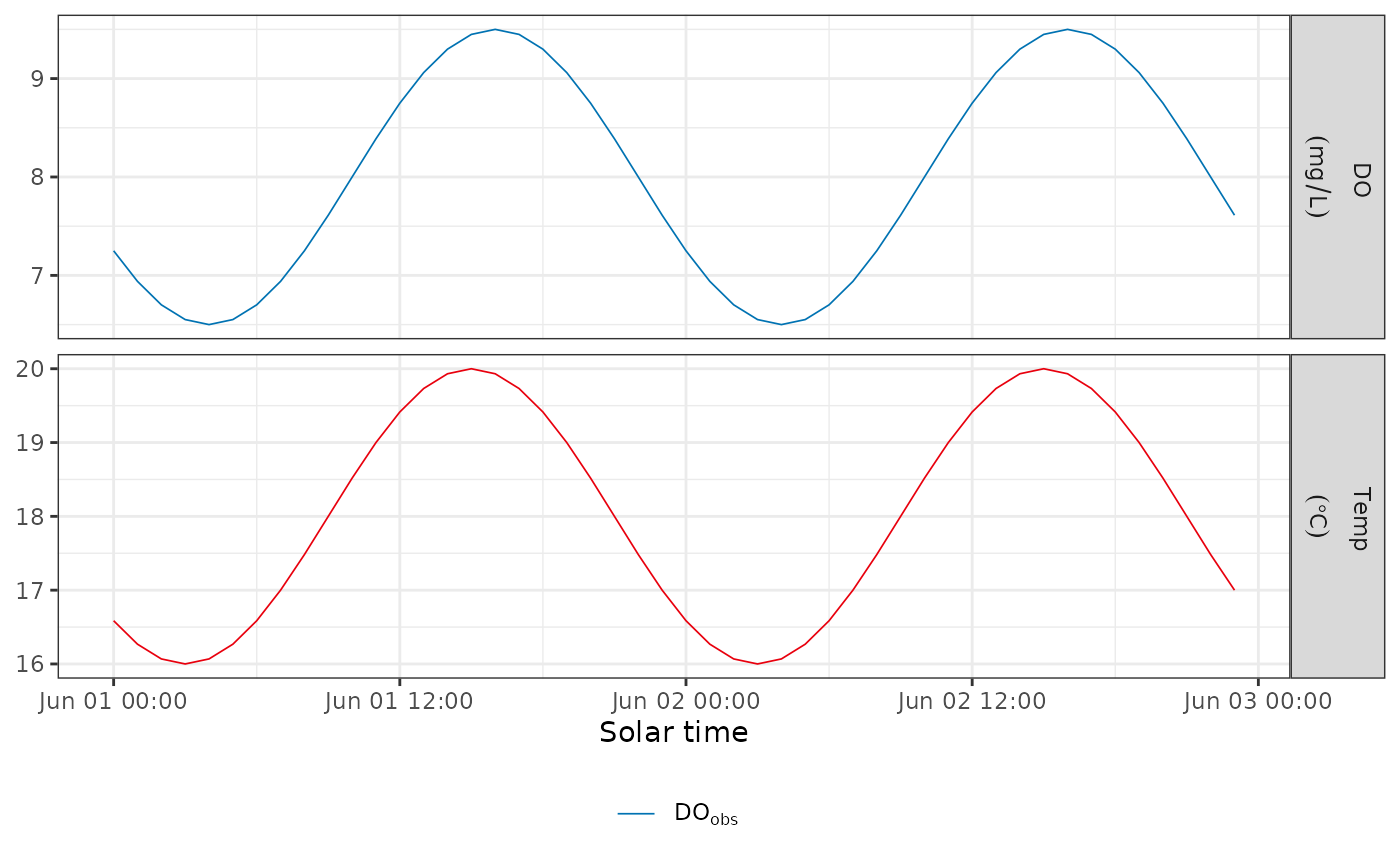
 plot_metab_data(data, cols = c("DO.obs", "temp.water"))