Model solar insolation on a horizontal surface
Source:R/calc_solar_insolation.R
calc_solar_insolation.RdImplements the solar insolation equations described by Yard et al. (2005).
Usage
calc_solar_insolation(
  app.solar.time,
  latitude,
  max.insolation = convert_PAR_to_SW(2326),
  format = c("degrees", "radians"),
  attach.units = deprecated()
)
Arguments
- app.solar.time
POSIXct vector of date-time values in apparent solar time, e.g., as returned by
convert_UTC_to_solartime(..., time.type="apparent solar").- latitude
Numeric value or vector indicating the site latitude in decimal degrees (never radians or deg-min-sec, no matter what
formatis) between -90 (South Pole) and 90 (North Pole).- max.insolation
Insolation rate at solar noon, W/m2 == J/s/m2. varies greatly with atmospheric conditions.
- format
The format of both the input and the output. May be "degrees" or "radians".
- attach.units
Deprecated. A logical. Should the returned vector be a unitted object?
Examples
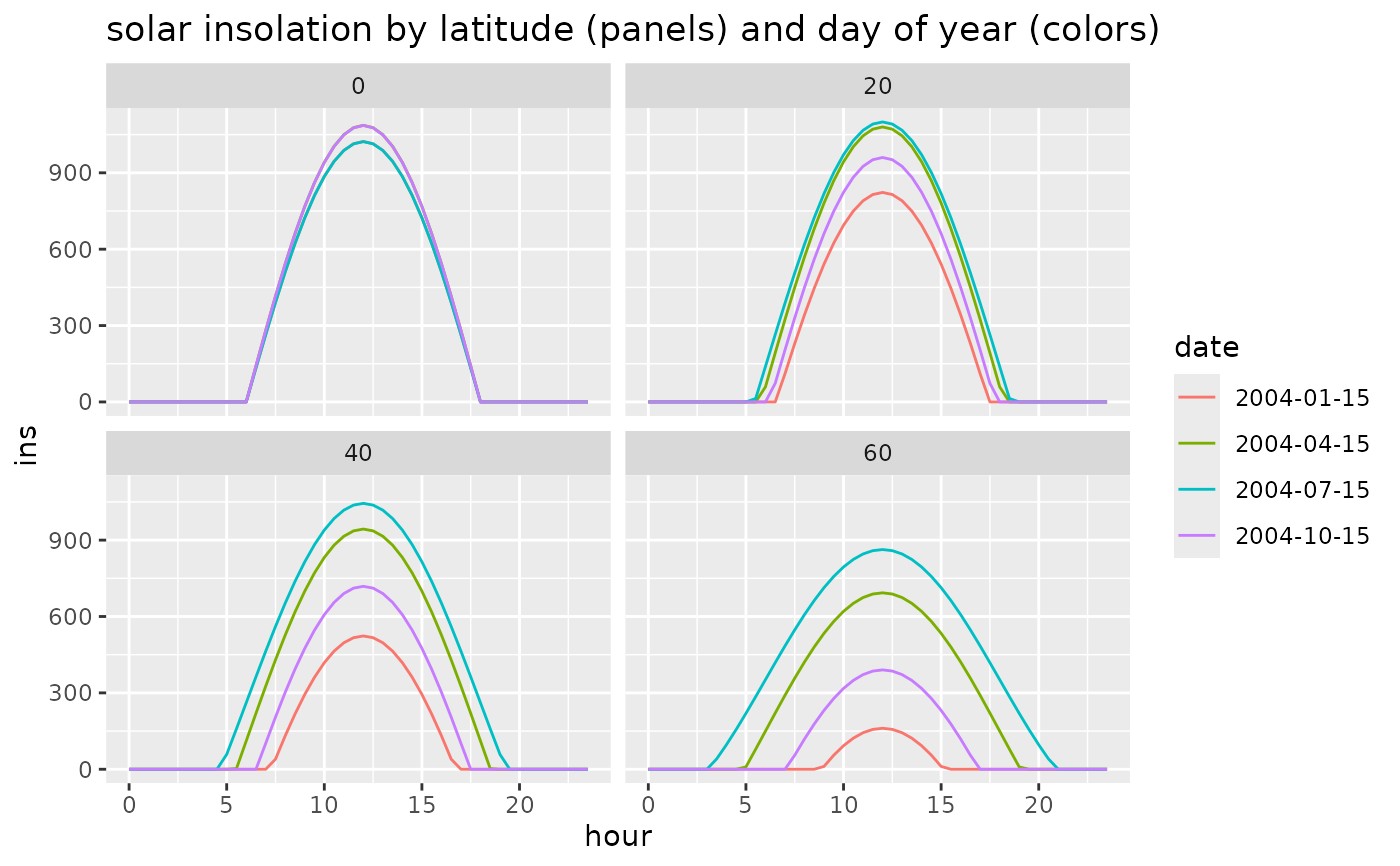
insdf <- data.frame(
  lat=rep(c(0,20,40,60), each=48*4),
  date=rep(as.Date(sprintf('2004-%d-15', rep(c(1,4,7,10), each=48)), tz='UTC'), times=4),
  hour=rep(seq(0,23.5,0.5), times=4*4)
)
insdf <- transform(insdf, datetime=lubridate::with_tz(as.POSIXct(date), 'UTC') +
  as.difftime(hour, units='hours'))
insdf <- transform(insdf, date=as.character(date))
insdf <- transform(insdf, ins=calc_solar_insolation(datetime, lat))
library(ggplot2)
ggplot(insdf, aes(color=date, y=ins, x=hour)) +
  geom_line() + facet_wrap(~lat) +
  ggtitle('solar insolation by latitude (panels) and day of year (colors)')