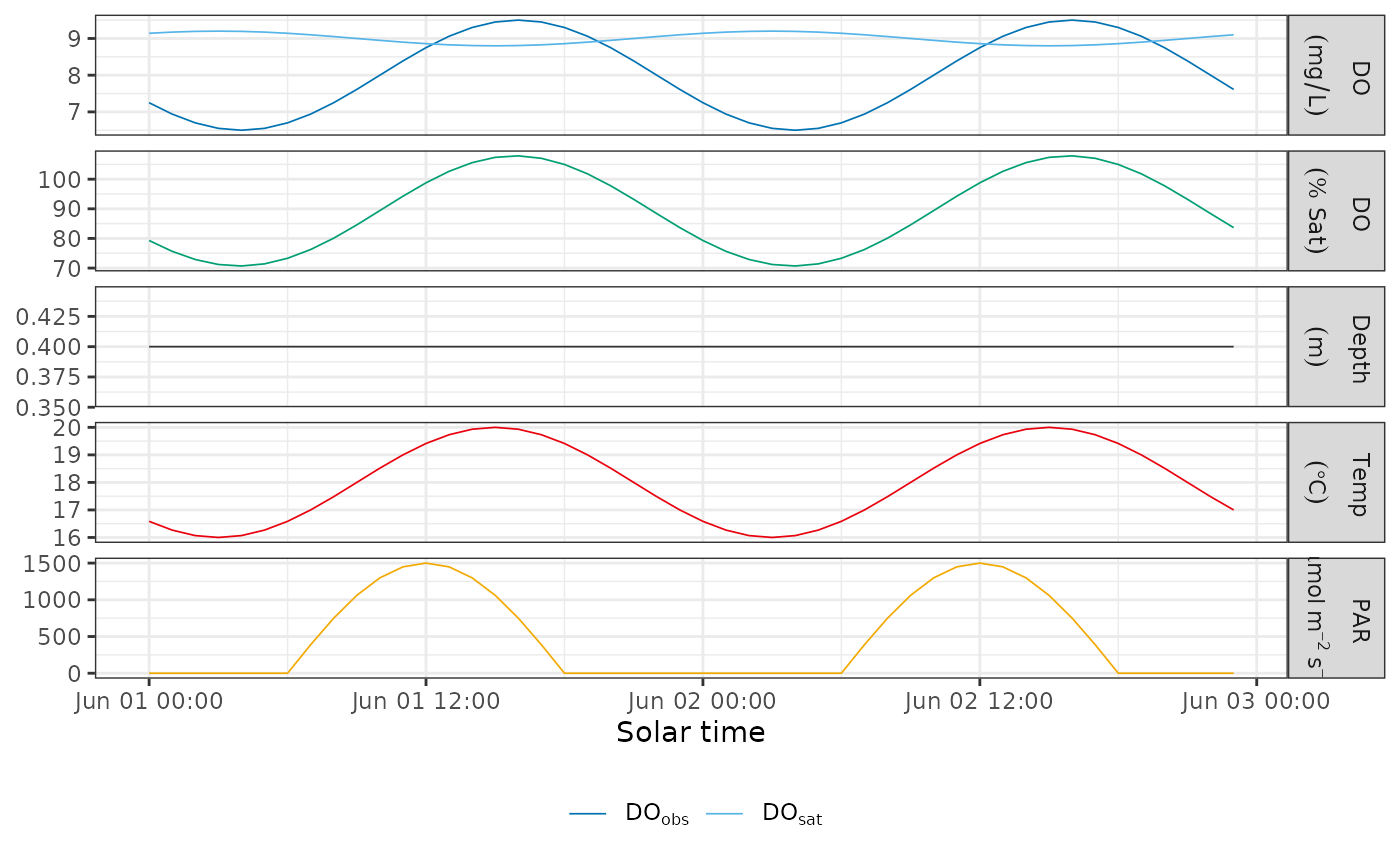
Plot metabolism input measurements in separate panels to help identify outliers and other data-quality issues before fitting a model.
Usage
plot_metab_data(
  data,
  cols = c("DO.obs", "DO.sat", "depth", "temp.water", "light")
)
Arguments
- data
A data frame or tibble with a
solar.timecolumn and the measurement columns named incols. The measurement columns must be numeric.- cols
Character vector of measurement columns to plot. Any subset of
"DO.obs","DO.sat","depth","temp.water", and"light". Defaults to all five. The dissolved oxygen saturation percentage panel is shown when both"DO.obs"and"DO.sat"are selected.
Value
A ggplot object. The dissolved oxygen saturation percentage is
calculated as 100 * DO.obs / DO.sat; values where DO.sat is zero are
shown as missing.
Examples
hours <- 0:47
data <- tibble::tibble(
solar.time = as.POSIXct("2024-06-01", tz = "UTC") + hours * 3600,
DO.obs = 8 + 1.5 * sin((hours - 10) / 24 * 2 * pi),
DO.sat = 9 - 0.2 * sin((hours - 9) / 24 * 2 * pi),
depth = 0.4,
temp.water = 18 + 2 * sin((hours - 9) / 24 * 2 * pi),
light = pmax(0, sin((hours - 6) / 12 * pi)) * 1500
)
plot_metab_data(data)
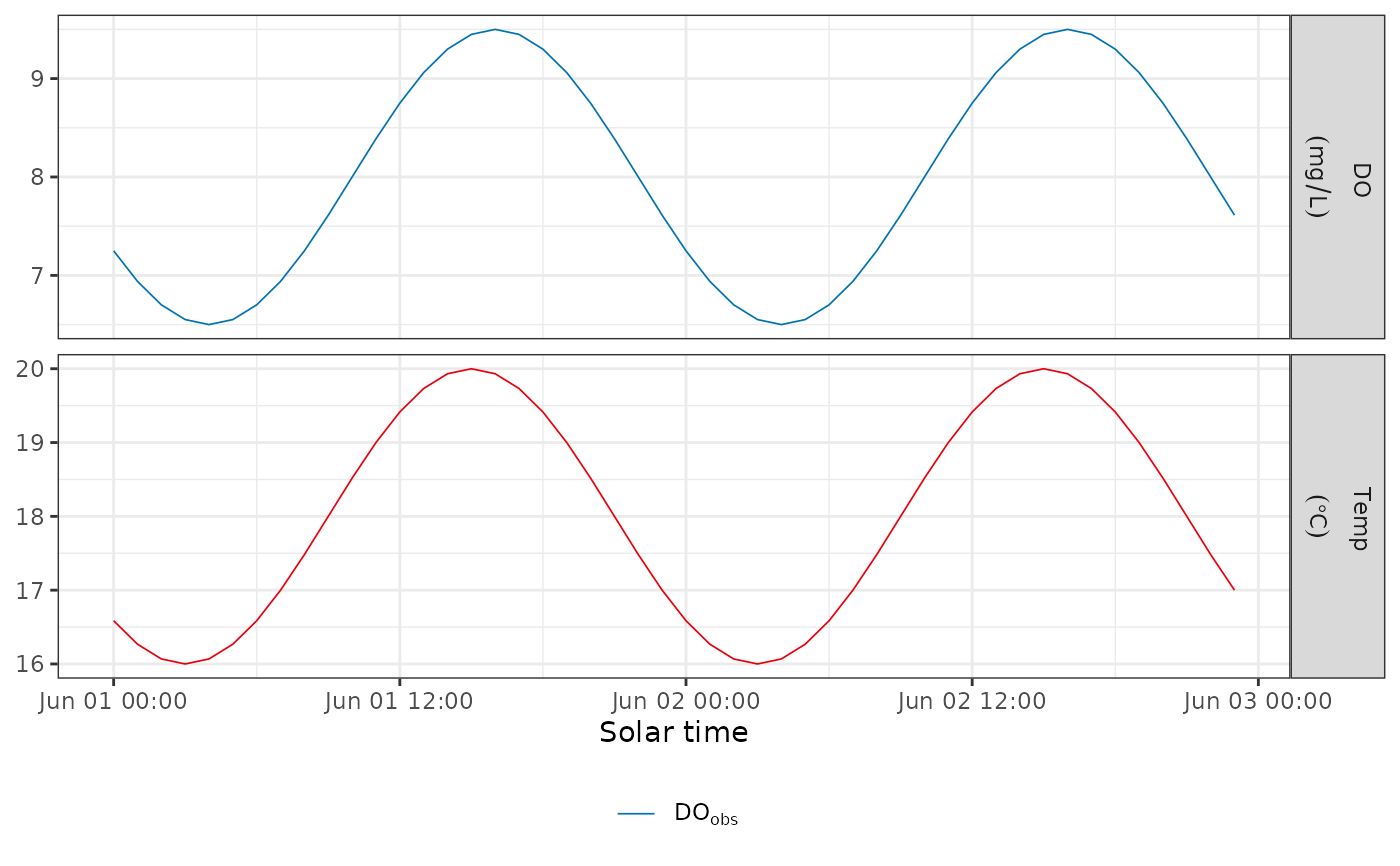
 plot_metab_data(data, cols = c("DO.obs", "temp.water"))